Search our catalog of QMods, financial widgets that create powerful client experiences.
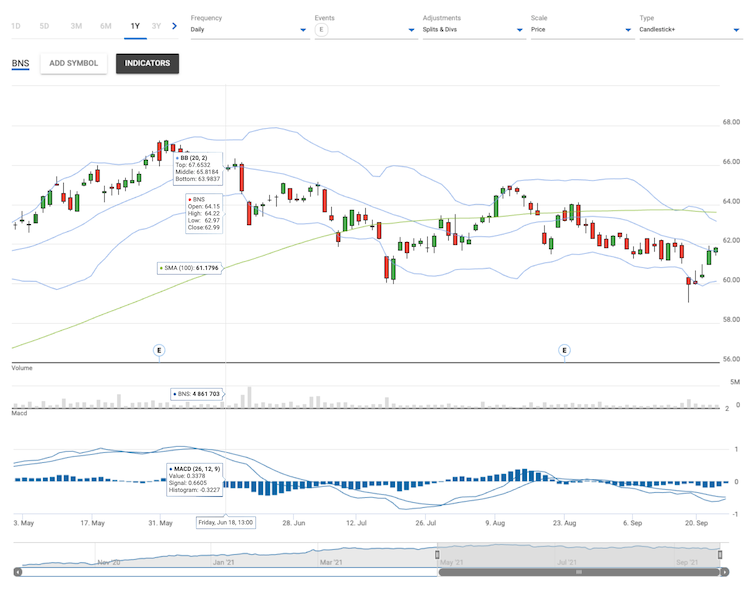
Compare up to five symbols with customizable chart types and advanced indicators, perfect for analyzing trends, momentum, and events to uncover lucrative opportunities.
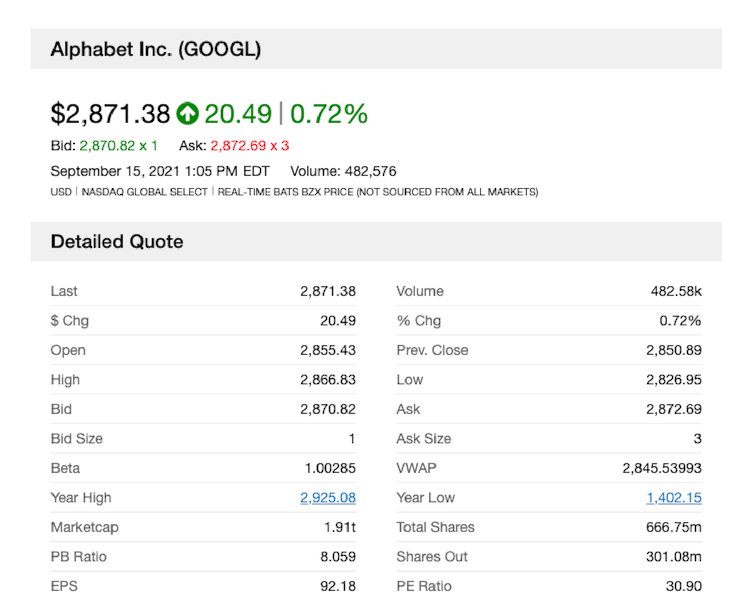
See key metrics like bid/ask, high/low, and volume in a clean table layout that provides an instant snapshot of market activity.
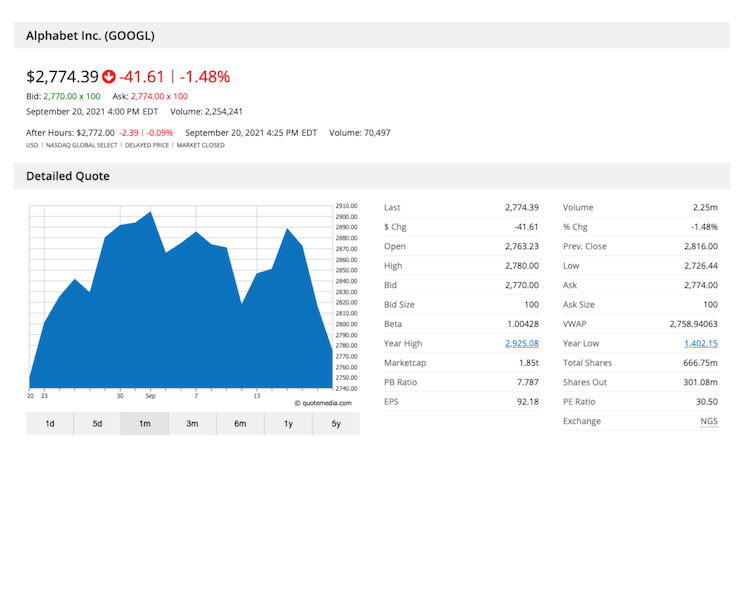
Access all quote data plus an integrated chart that connects price action to recent trends for faster, visual market analysis.
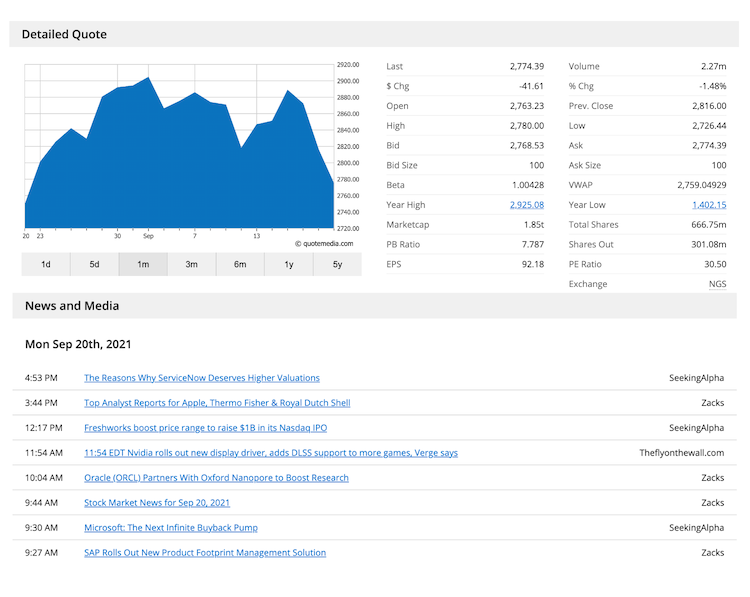
Combine quote data, a simple price chart, and relevant headlines to link movements with related market news instantly.
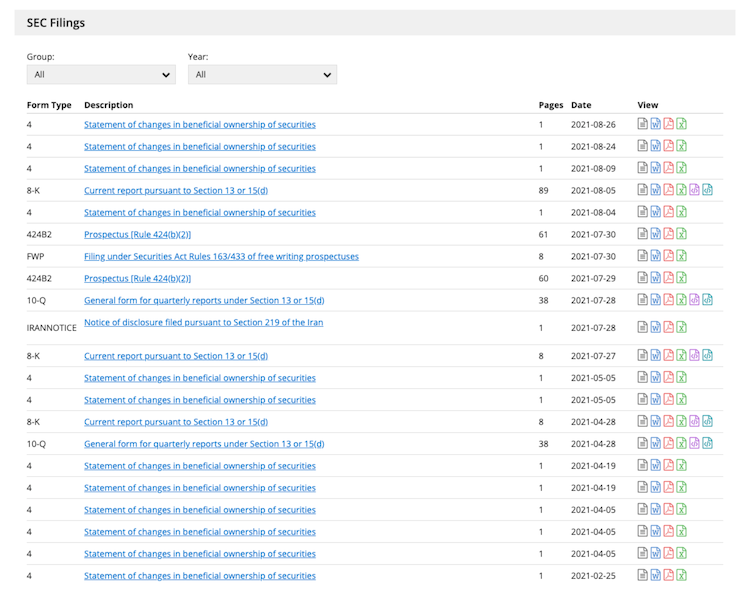
Access financial statements and corporate filings to review disclosures, analyze performance, and understand company developments.
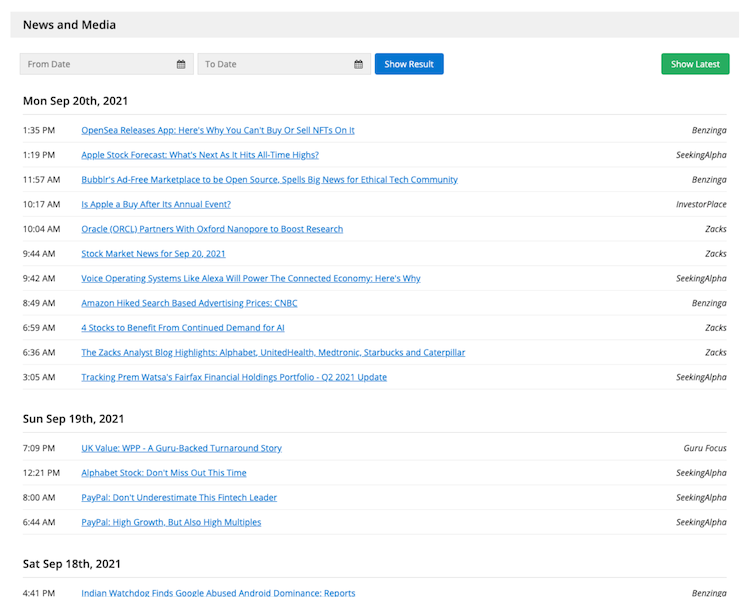
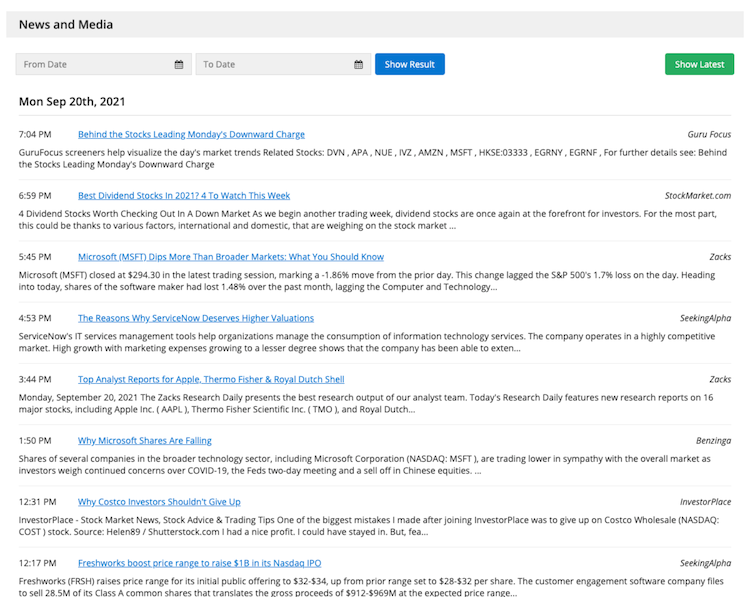
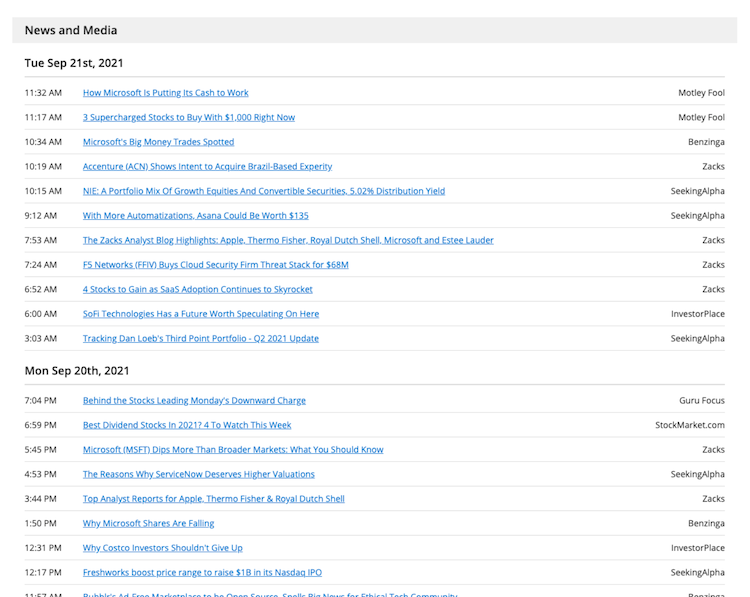
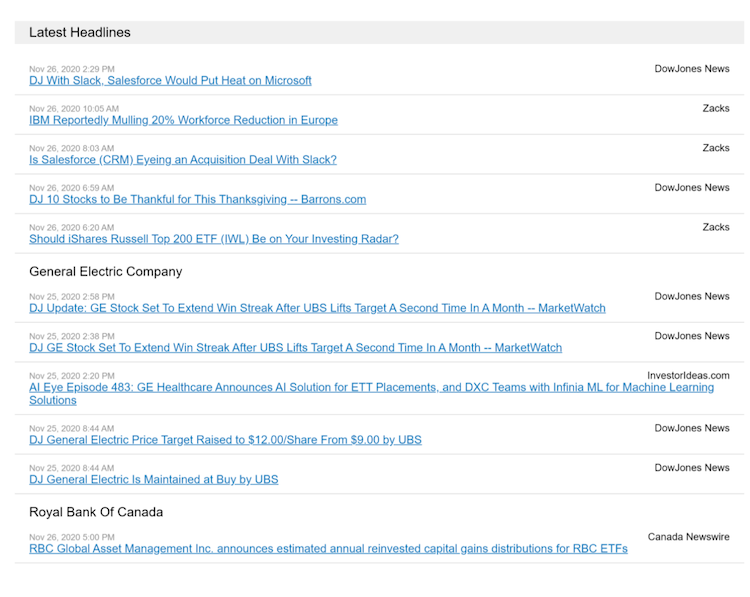
Stay current with real-time or historical headlines to track key events driving company performance and market sentiment.
Read concise news summaries with key highlights to understand what’s influencing a stock or market in moments.
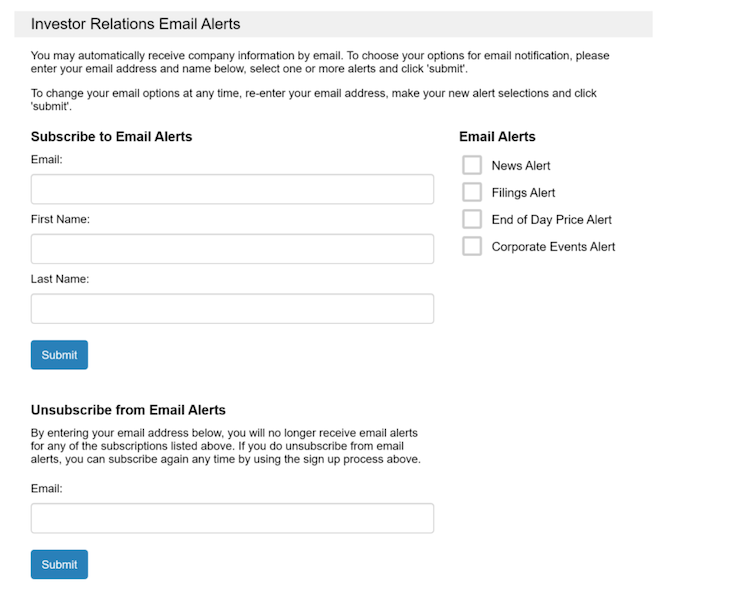
Deliver instant relations updates to subscribers as company news and events are released through automated email alerts.
Browse headlines and story summaries in a compact, mobile-friendly view that keeps you informed about market and company events.
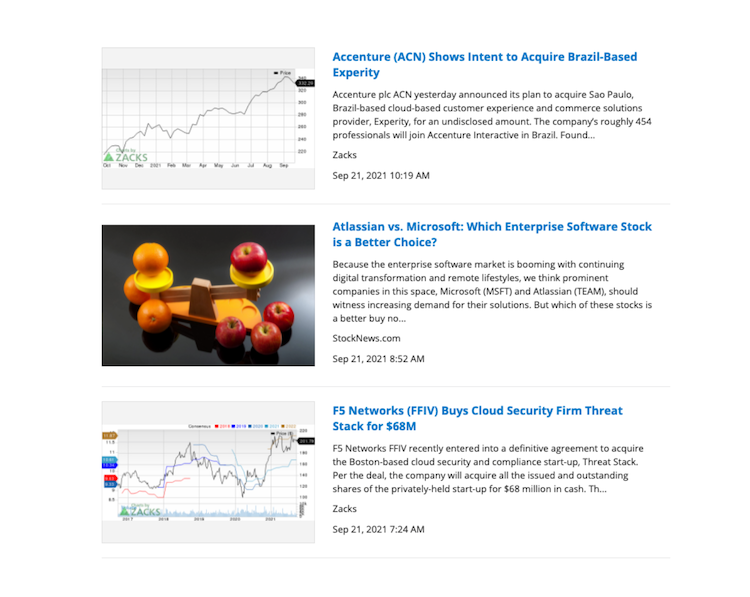
Access news enriched with images and videos for selected companies or symbols, offering a more visual and engaging news experience.
Display scrolling headlines with clickable access to full stories, keeping users updated on relevant financial news.