Search our catalog of QMods, financial widgets that create powerful client experiences.
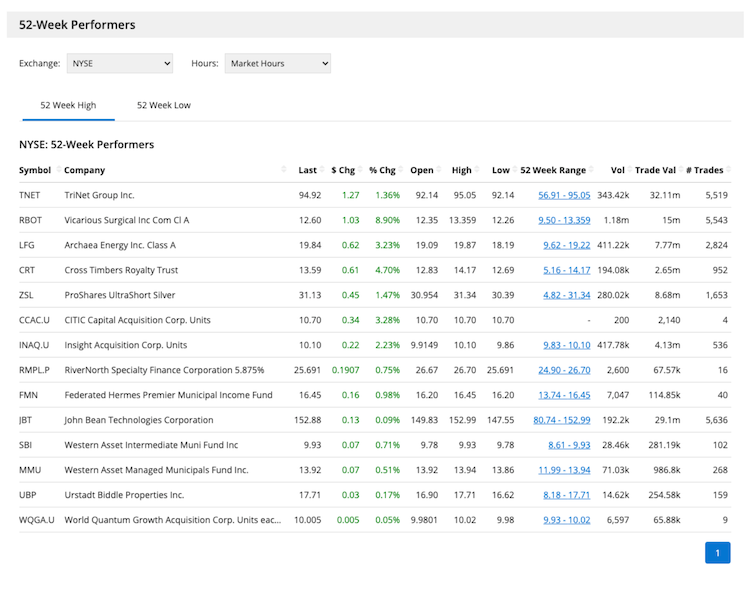
See equities hitting new 52-week highs or lows on your selected exchange, helping you to identify leaders, laggards, and potential reversals quickly.
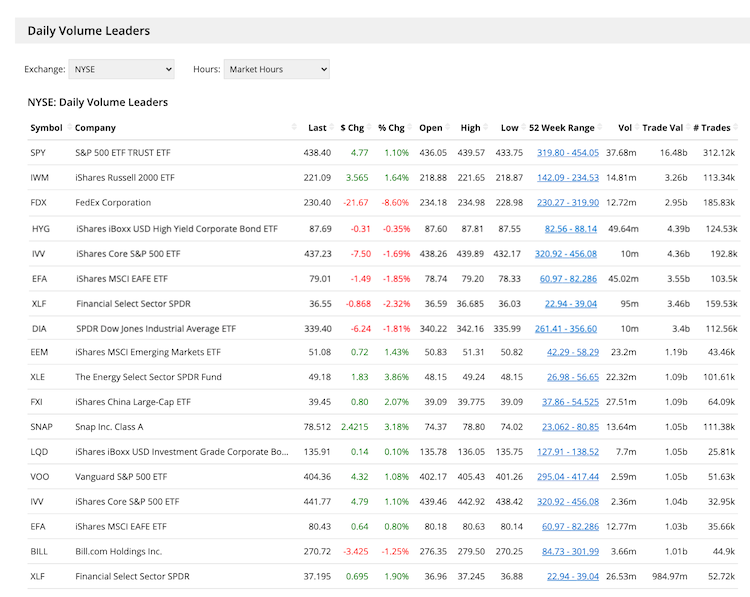
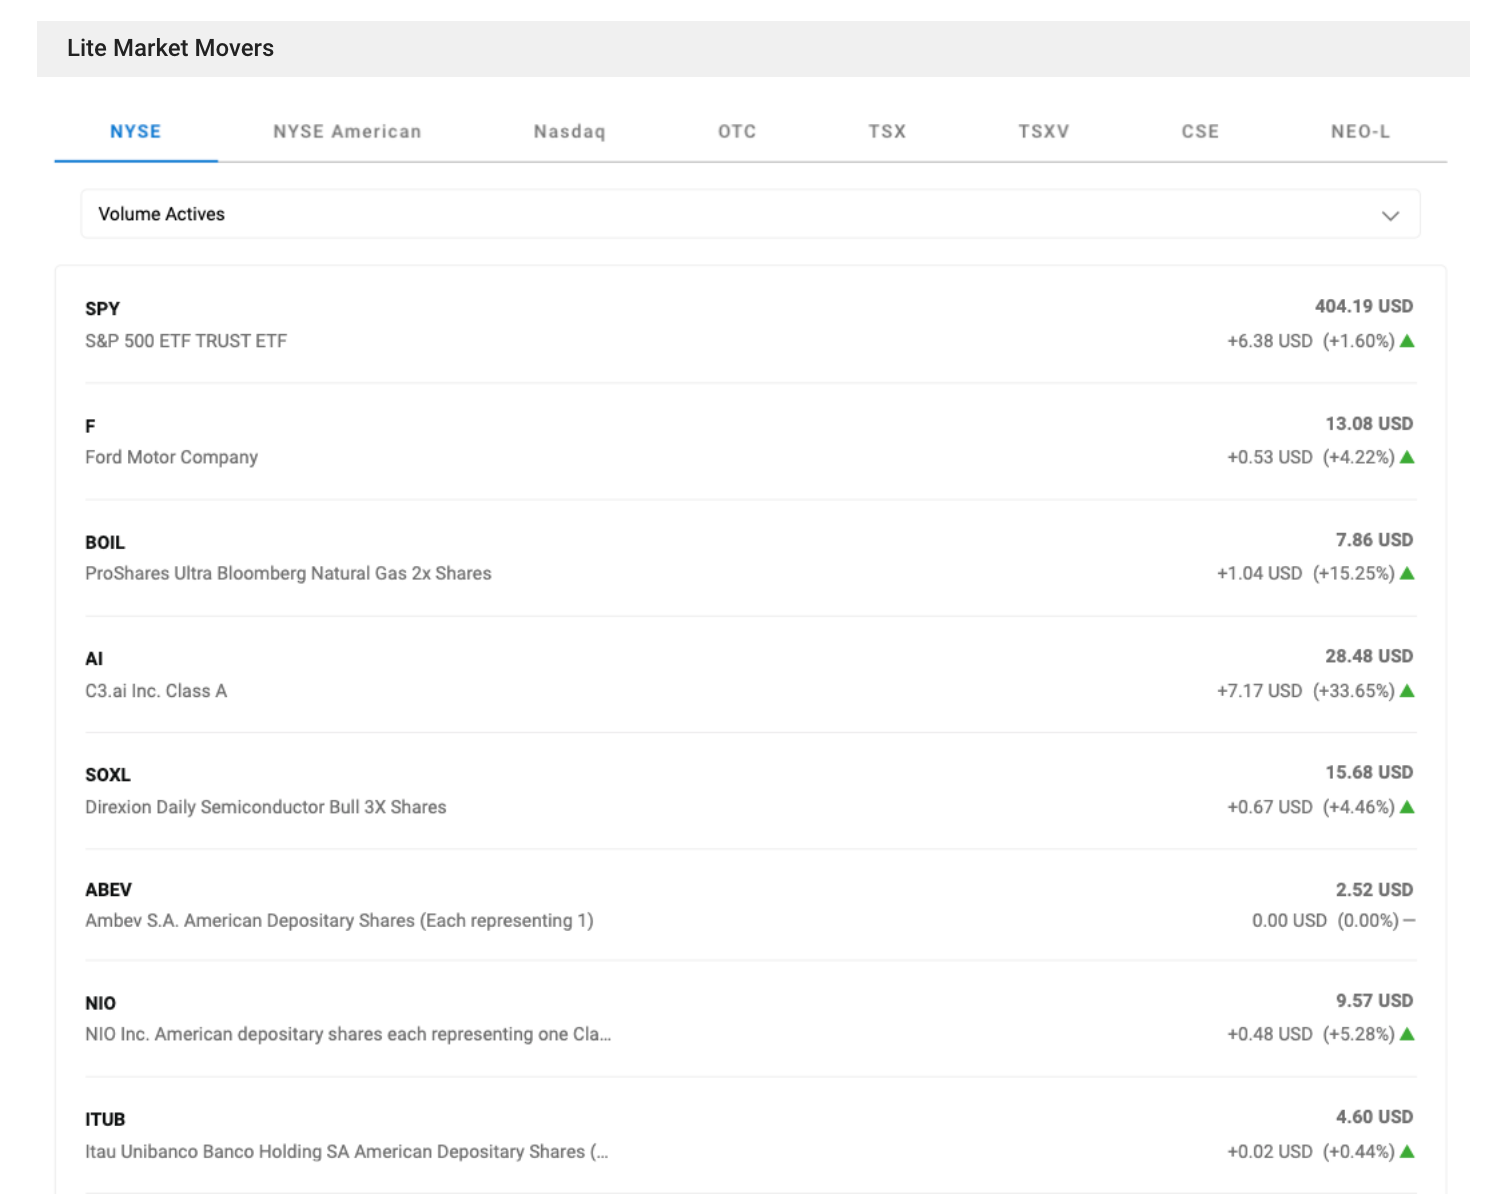
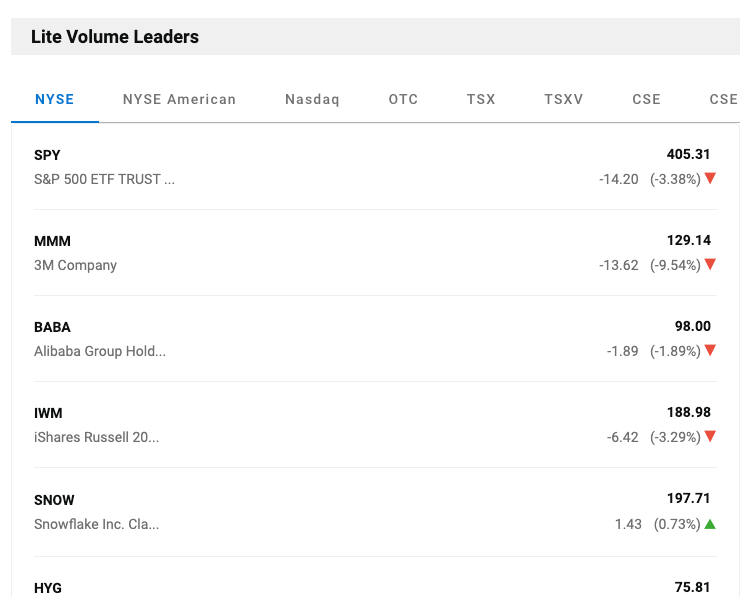
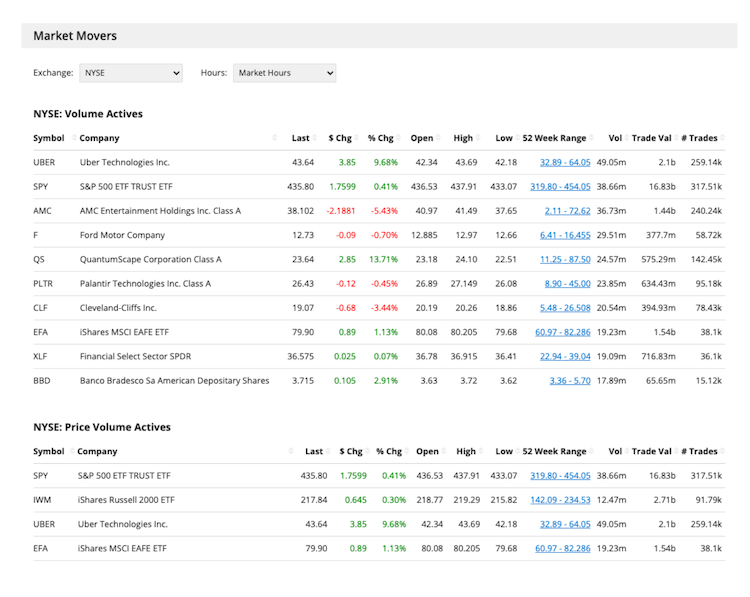
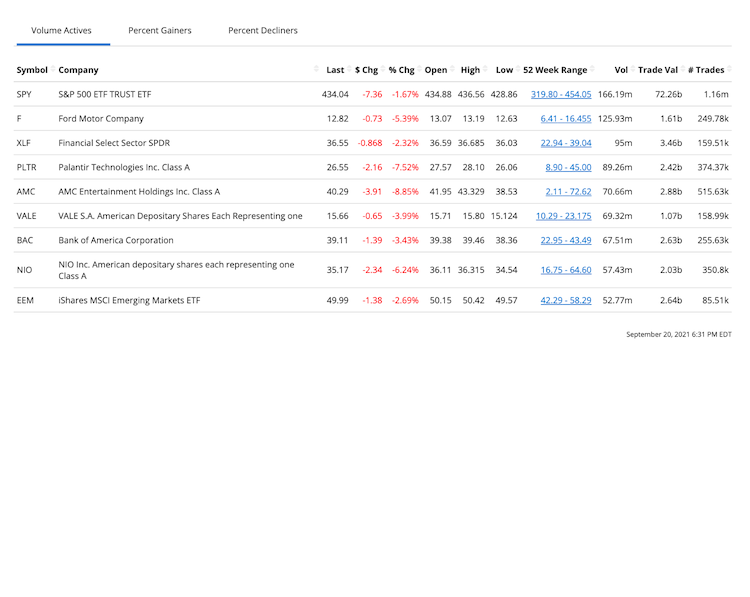
Find the day’s top and bottom stocks by volume to identify where market attention, activity, and potential trade opportunities exist.
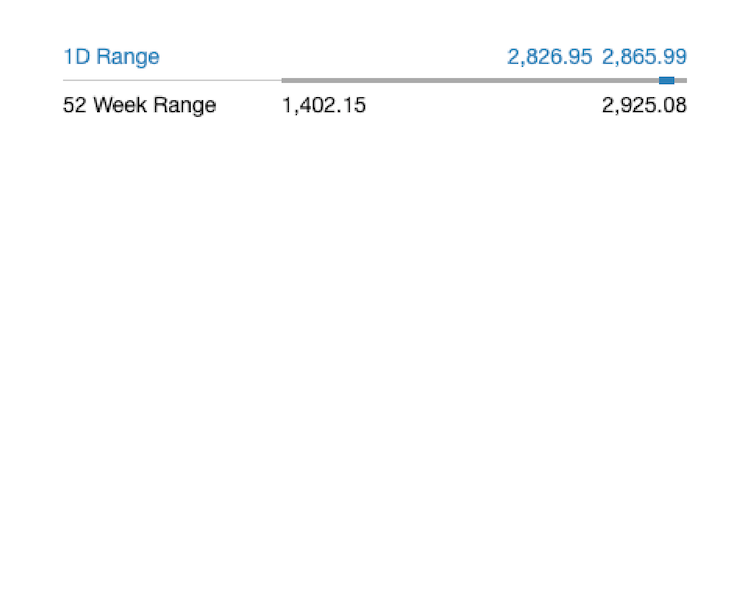
View intraday and 52-week high-to-low ranges in one place to measure positioning volatility and price momentum effectively.
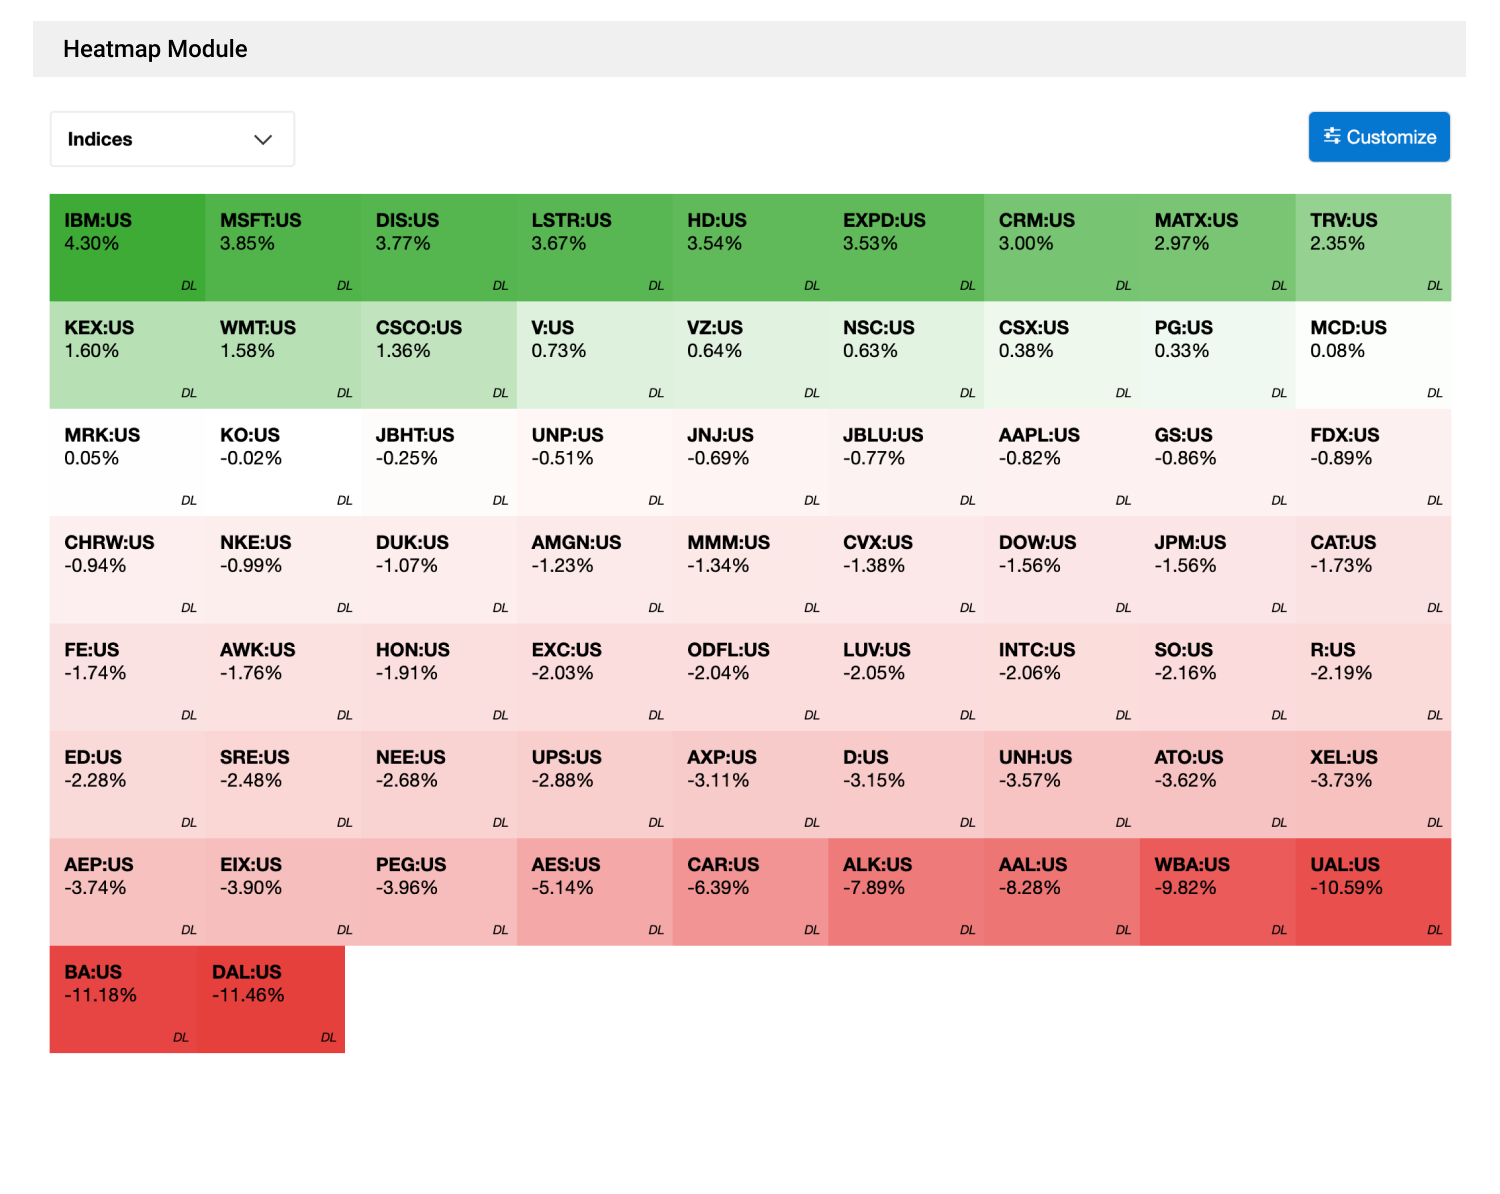
Visualize market performance with interactive heatmaps showing sectors and companies sized by market cap and price change.
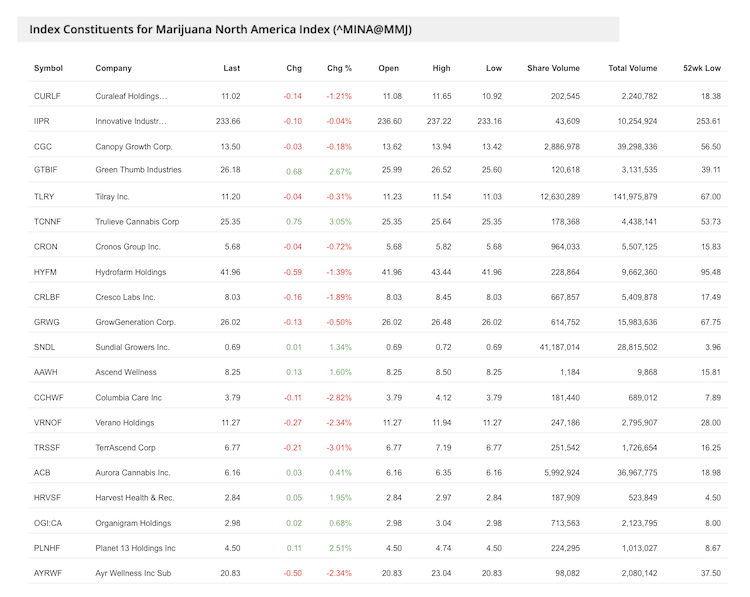
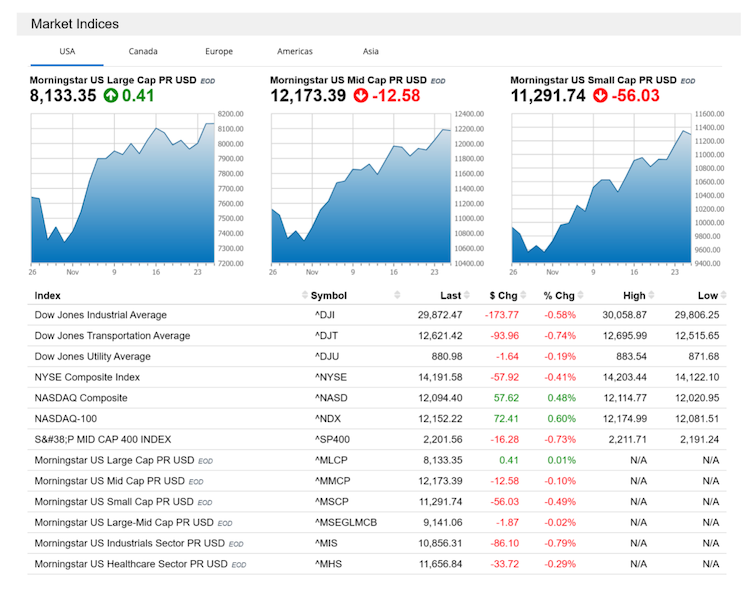
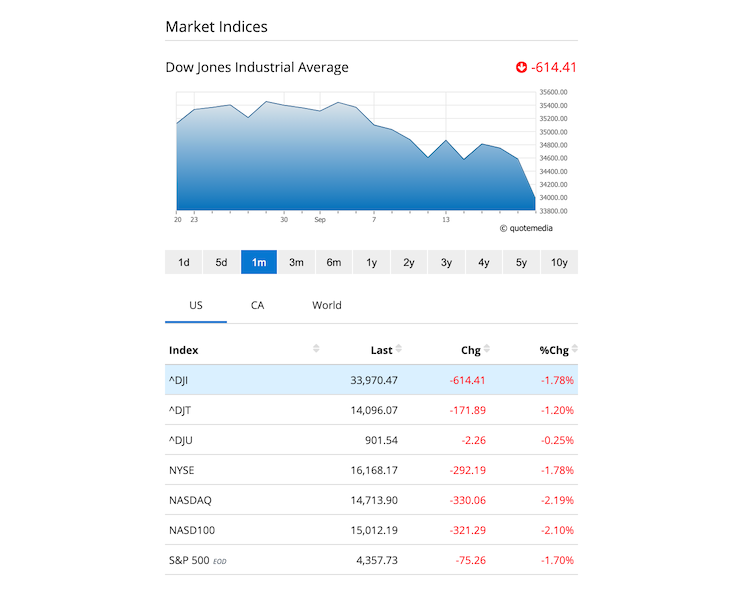
View detailed performance and pricing data for each company within a selected index to identify which holdings drive index movement and trends.
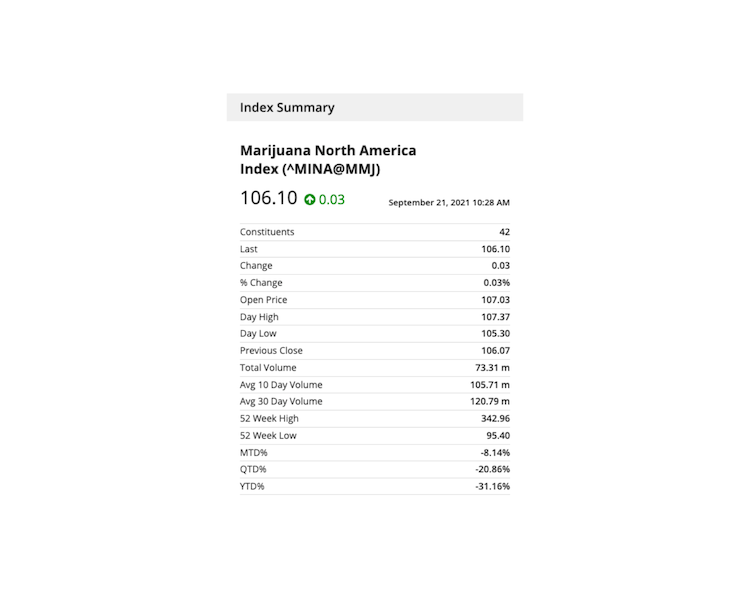
Get a concise overview of key index metrics, price, performance, and volume, to quickly and confidently track market direction.
View live index performance and daily changes in a simplified, mobile-friendly format for fast, on-the-go reference.
Track top gainers, losers, and active stocks in a mobile-ready layout that delivers quick market insights anytime, anywhere.
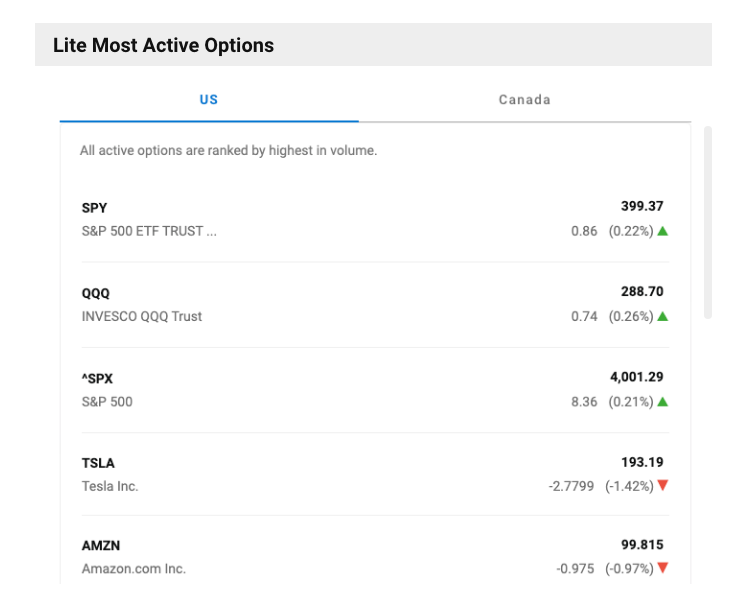
See the most active call and put options in a streamlined, mobile interface to quickly monitor derivative trading activity.
Identify the day’s top and bottom volume movers using a mobile-optimized layout built for quick scanning and comparison.
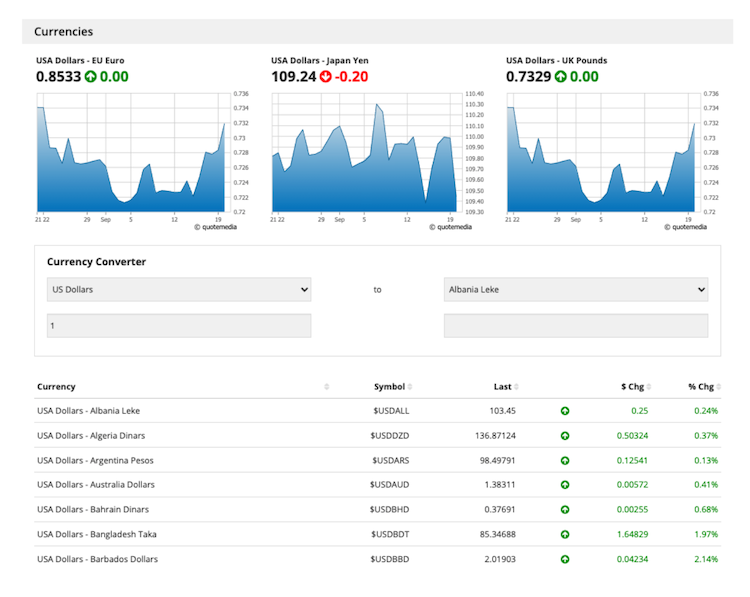
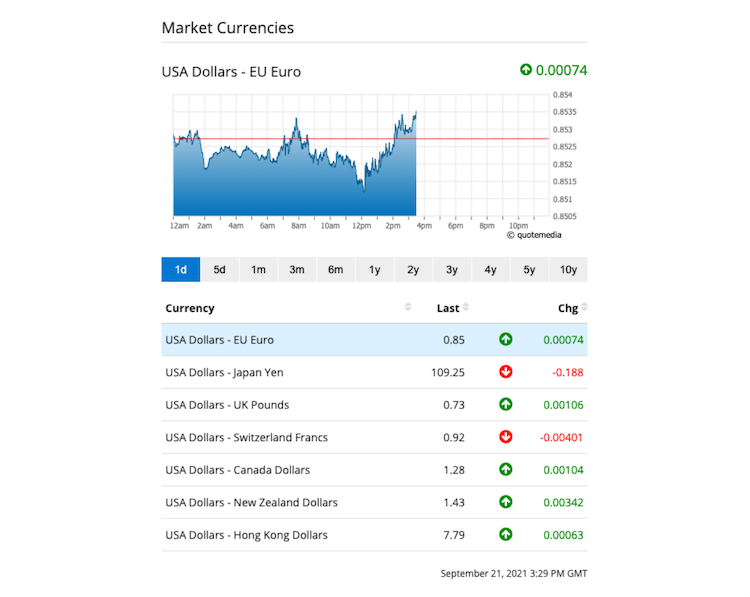
Monitor real-time global currency exchange rates and conversions with cross-pair comparisons for quick forex market insights.
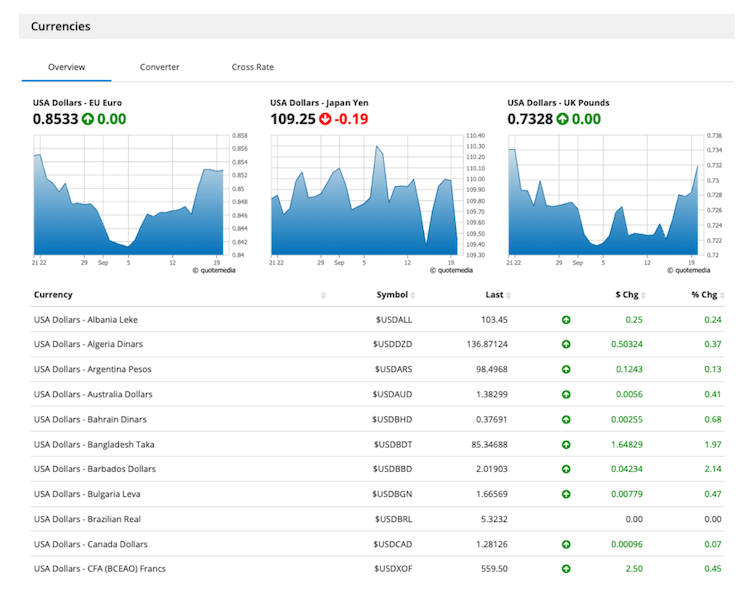
Access currency rates and comparisons in a compact, tabbed layout that saves space while maintaining live market visibility.
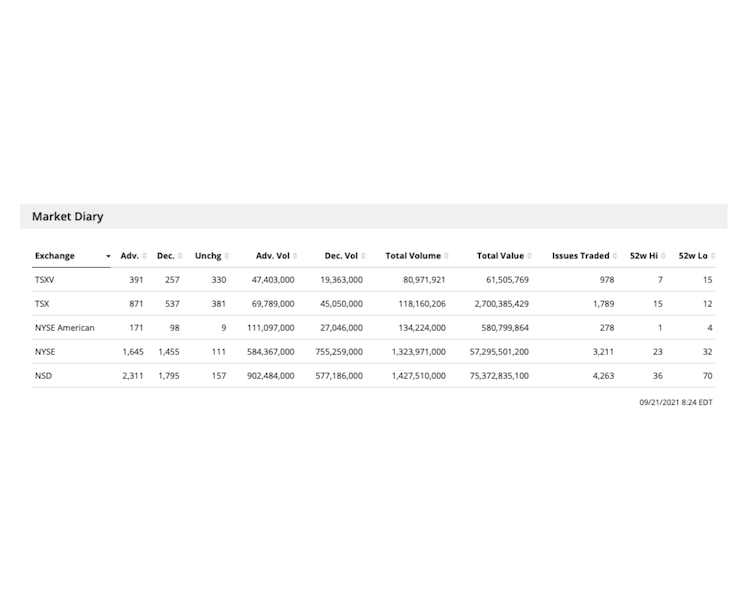
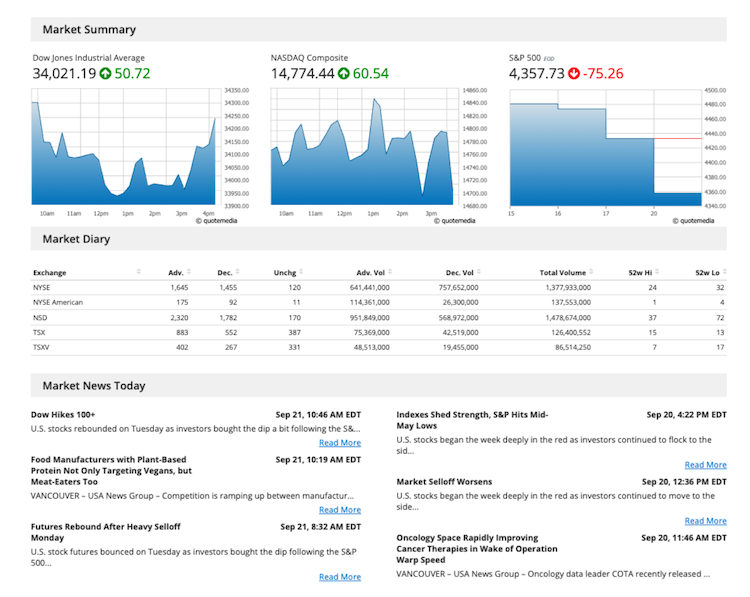
Get a clear summary of the US and Canadian markets, including daily movement, volume data, and yearly high-to-low ranges.
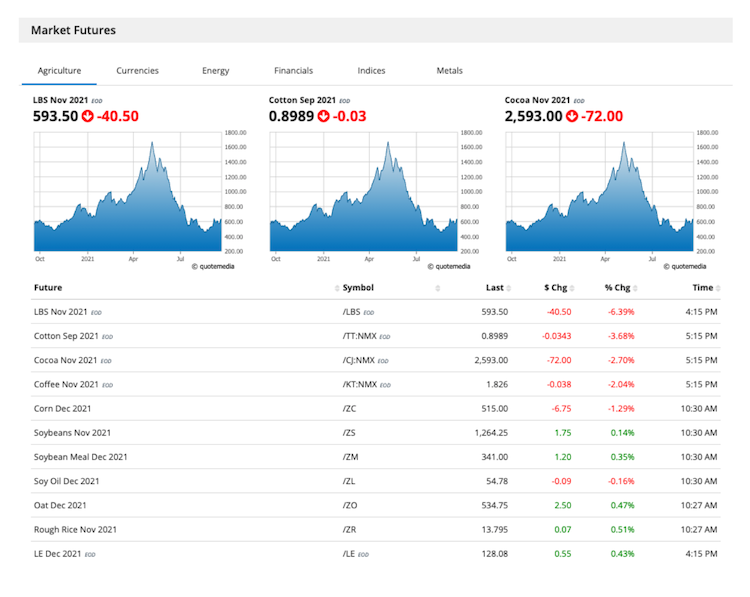
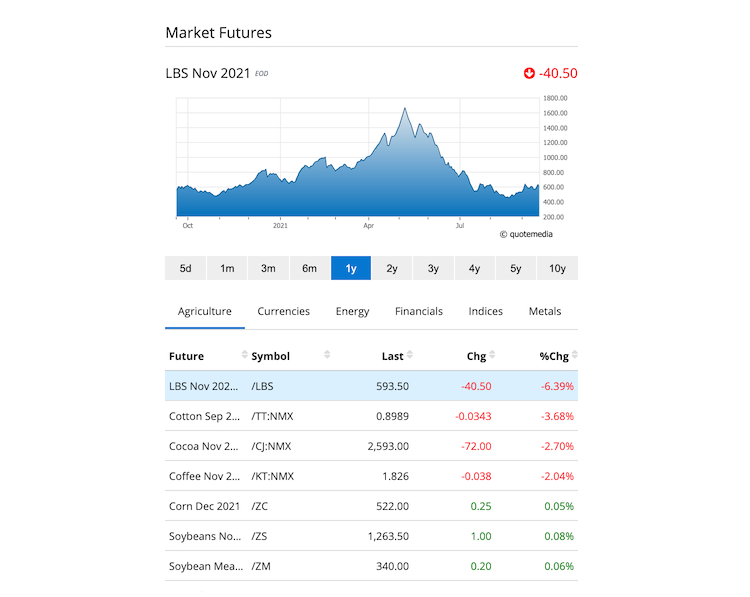
Track global futures markets with live prices, percentage changes, and contract data to monitor trends, gauge sentiment, and identify trading opportunities.
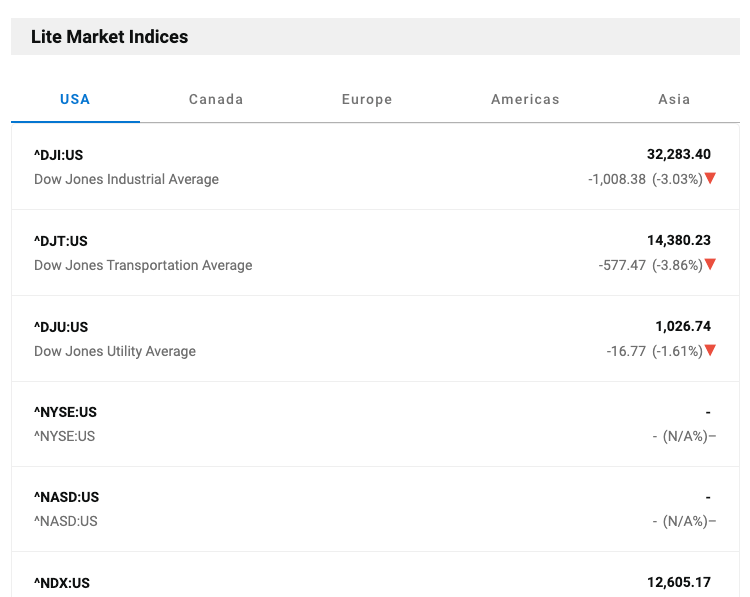
View live index performance with prices, changes, and daily highs and lows to stay updated on overall market direction and sector strength.
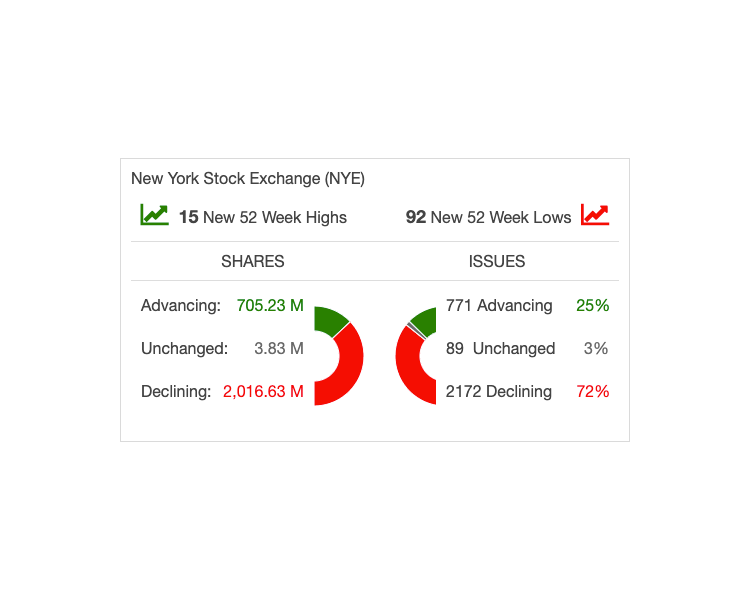
See advancing and declining issues to measure overall market participation, breadth, and strength across different exchanges and timeframes.
Identify the day’s top gainers, decliners, and most active stocks by exchange to discover where volume and market energy are building.
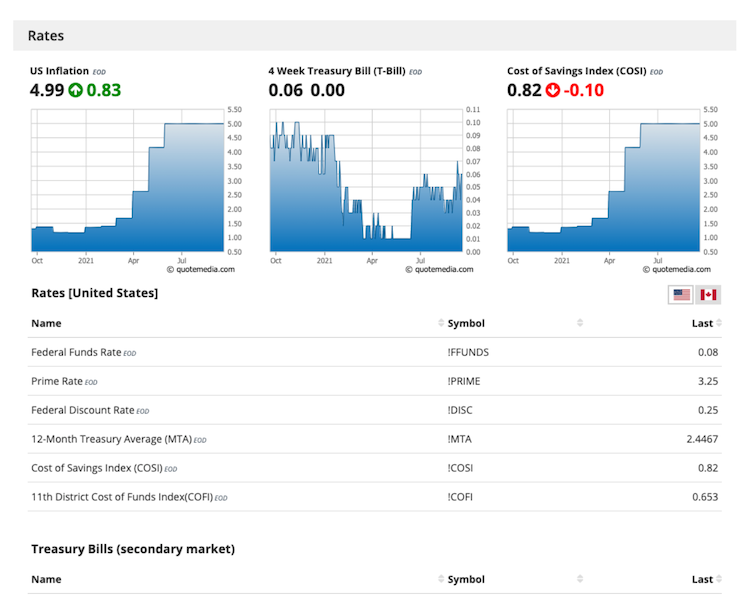
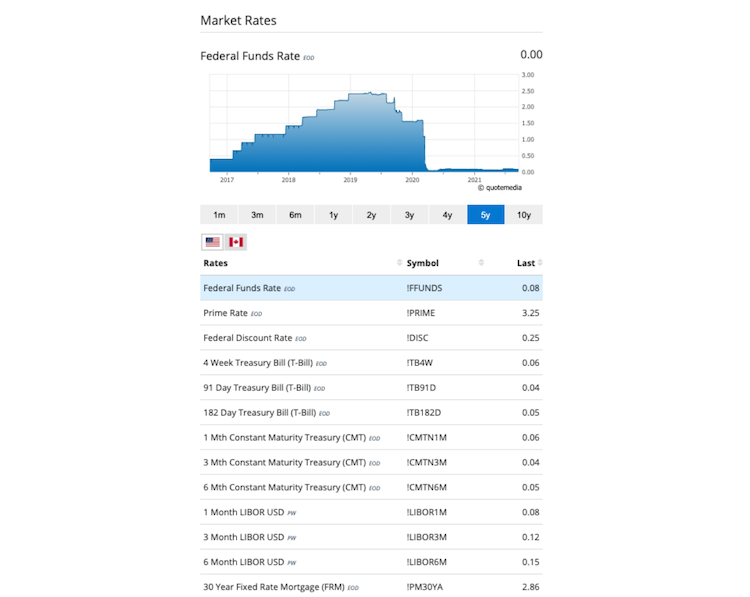
Access key global interest rates, yields, and economic indicators to assess monetary trends and their impact on market sentiment.
Get a complete daily overview of market performance, including charts, indices, volume, and forex activity, all in one easy-to-use view.
Track real-time global currency rates in a condensed view, ideal for dashboards and streamlined financial displays.
View live futures data in a compact, efficient format designed for quick checks and dashboard integration.
Monitor market indices in a smaller, mobile-friendly format that shows prices, daily changes, and trend lines.
See leading gainers and laggards in a simplified layout with real-time updates on price movement and trading volume.
Access interest rates and yield data in a minimal display for quick market reference and economic tracking.
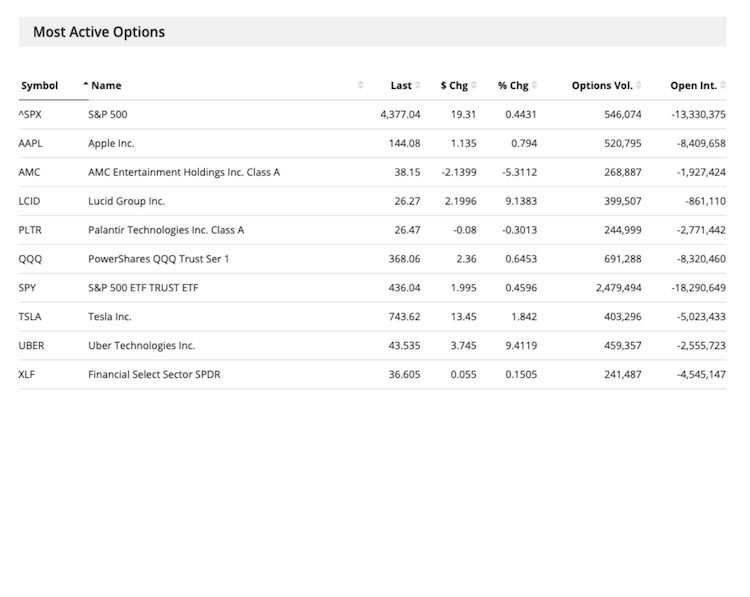
See which companies have the highest or lowest option contract activity to gauge where investor attention and market speculation are focused.
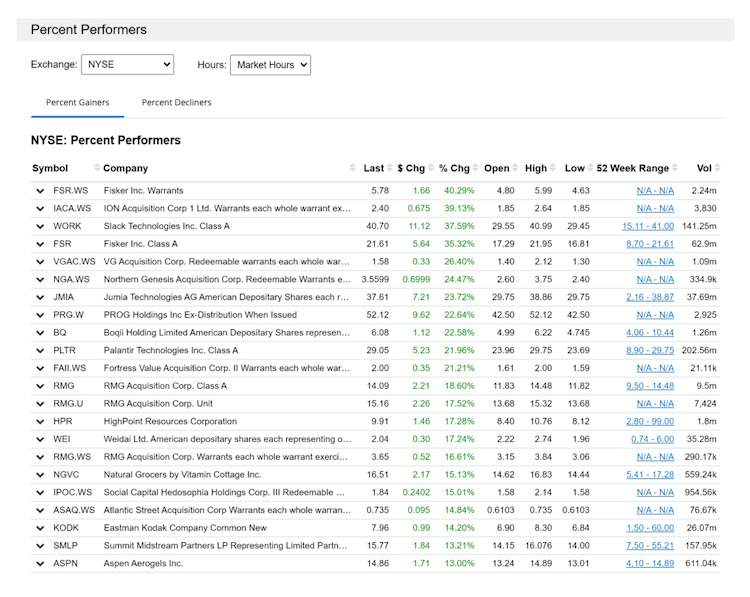
See companies ranked by percentage gain or loss to quickly spot market leaders, laggards, and short-term performance trends.
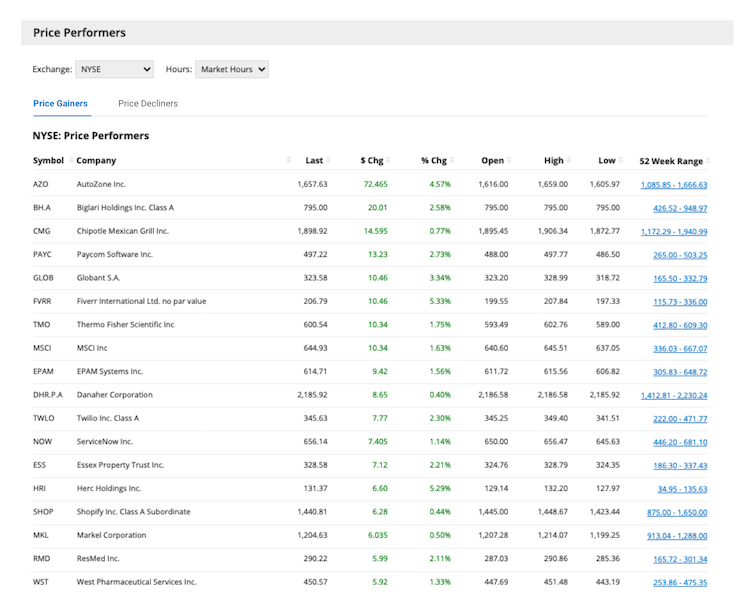
Rank companies by absolute price change to spot key movers and identify emerging trends in market performance.
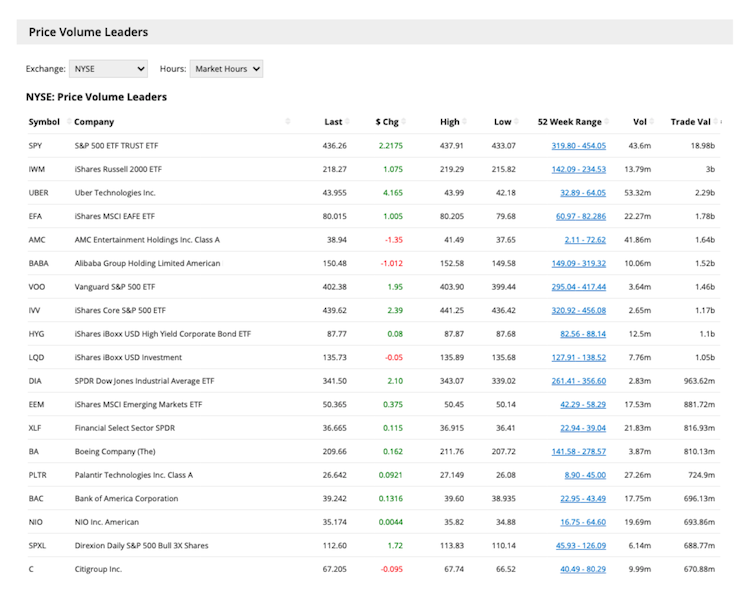
Find companies with the highest trade values by exchange to reveal where capital flow and market activity are concentrated.
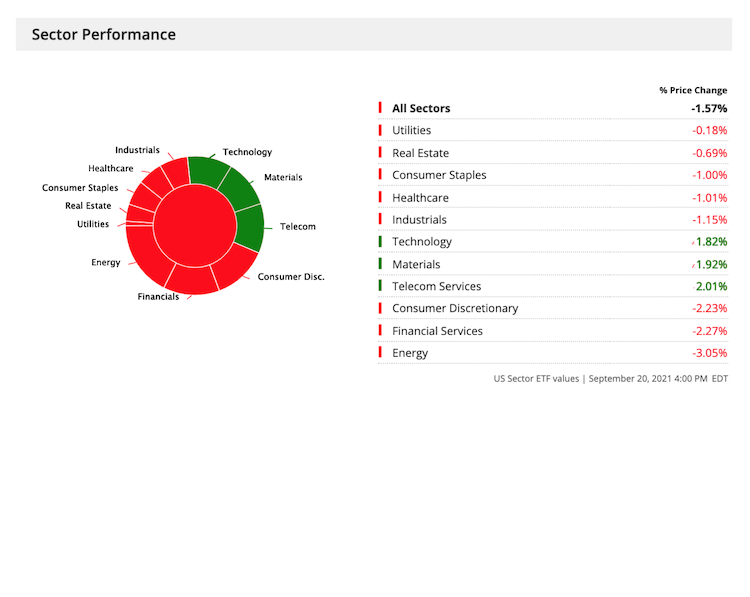
View how each market sector is performing today to identify leading industries and rotational shifts in market strength.
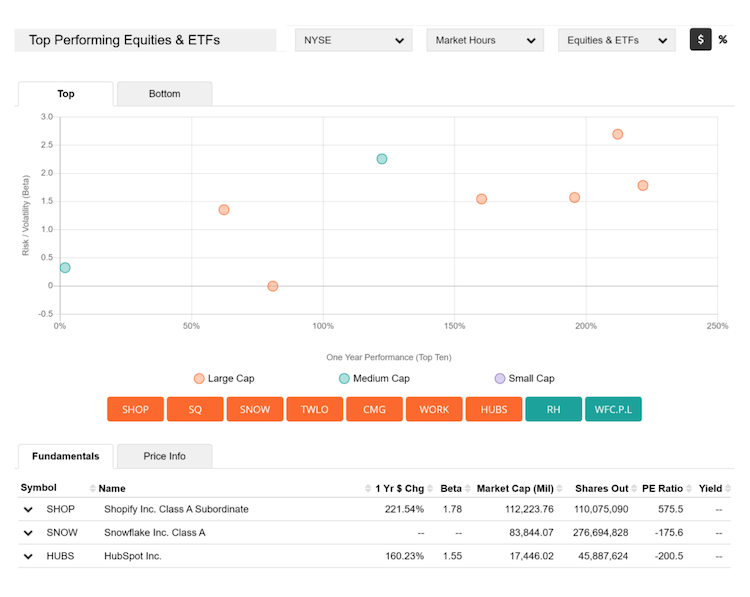
View top-performing equities and ETFs across selected markets to track leaders and benchmark overall performance.